Walking meeting #1

I have done my first walking meeting!

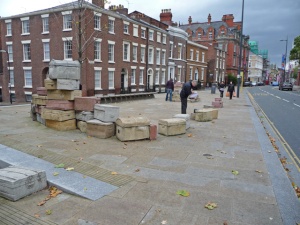
#1 Walking Meeting, Hope Street, Liverpool

#1 Walking Meeting, Hope Street, Liverpool

What is a walking meeting? I first came across this via my colleague who ran a postgraduate workshop. The idea is that rather than being stuck in an office, you take a walk with your meeting partner. And this walk will be creative, open – with unexpected outcomes as well as being a healthy way of spending your work time. See more by Nilofer Merchant’s TED talk:

And of course, everything started with the classics: see Aristotle’s Peripatetic school.

So it happened. I met up with Gwenda Mynott, LJMU, at a research conference. We shared the same interests, by accident turned out to be neighbours at a different institution. We didn’t need any papers to talk over and the weather was nice and Gwenda was open to try it, so here is what happened:

We met outside, and took a walk – mostly in a nearest point of tourist interest. But the first corner was actually my old masters institution, so inevitably started talking about my masters. Turns out Gwenda  used to teach on this programme a few years after, something we may not have discovered otherwise!

But without the details of our walk & talk, what I observed is that walking through the city and the buildings gave us points to talk about, sometimes work-related, sometimes personal. We kept on talking and sharing our research interests. Since then I talked to others, and we agreed that you ‘think’ differently when walking. You usually have a starting point and end end point of your journey, and perhaps this gives an unconscious frame to your talk. A bit like the thinking space of a train journey. I usually do my long term planning on a train – a train journey and that tiny little desk in front of me with papers somehow gives me space to think about without being bogged down in the detail.

My reflections:

  • The walking meeting works! (If you haven’t got many people and you don’t have to talk over reports or papers.)
  • Ideal for a first, exploratory meeting.
  • Where you walk can guide the conversation.

My next steps:
I am meeting up someone who is thinking about curriculum change. I am thinking that rather than meeting in an office, we could do a campus walk at places or buildings, rooms where his students are taught – to give us sparks, new insights and ideas about different teaching approaches.

Further reading:
Since I discussed this idea with colleagues, I got the following recommendations to explore:

http://www.theschooloflife.com

http://www.theschooloflife.com/shop/connecting-with-the-city/
and another book recommendation: Old Ways
With thanks to Gwenda – and I really look forward to my Walking Meeting #2!
 Tunde

Visual methods in assessment design

Just read a great article (and idea) from Exeter uni’s team which has won the prize for best Conference Proceedings Paper at ALTC-2013:

The authors have solved a curriculum design problem of how to create authentic, or work-integrated-assessments using a visual modelling and design process. They have developed a radar diagram based on six dimensions that ideally are present in a work integrated assessment. This tool helps staff map current assessments, identify the dimensions that can be improved. They then can use top trumps cards which have rated technology accordance s against these six dimensions and identify technologies that could help improve their current assessment model. Tool has been evaluated and found successful to use. The article describes a model that can be of interest to those wanting to embed employability in the curriculum (‘authentic tasks’).

Dimensions of work-integrated assessment

Dimensions of work-integrated assessment

The article is also of interest to me due to its use of visuals in this curriculum design process. Using visual representation in mapping has been becoming a prominent tool (see Hertfordshire’s ESCAPE project when they mapped assessment timings and high/medium/low-stake assessment using diagrams) – the idea being that quick visuals can communicate what needs changing more effectively. The interesting development was that an earlier version of mapping against a spectrum (of two ends)  seemed value-laden and so the team went with a radar-diagram representation along 6 dimensions, as they felt this representation didn’t put staff off by suggesting that their current practices were on a positive/negative scale. A really good insight on the importance of choosing the right visual – the inherent nature of diagrams/visuals does carry meaning.

Well done to the Exeter team!

Tunde

MOOC: E-Learning and Digital Cultures – Week 2 thoughts: A Day Made of Glass 2 #edcmooc

Our Week 2 MOOC task was to read Corning’s : A Day Made of Glass 2 conjures up some groovy technology in the form of glass, but when it comes to the educational vision, it is very conservative.

So few thoughts about what we had to consider when watching this video for this MOOC:

1. How is education being visualised here? What is being learned and taught?

  • I see this video quite conservative when it comes to displaying education, the teacher is still at the front and has a one-to-many relationship with the students. There is not much peer-to-peer learning (except in the forest, which we will come back to in a minute). There is still the monolithic school building, uniforms — and although there seems to be some exploratory activity going on with the children, it is very much surface. Students only seem to manipulate what has been prescribed to them. It links back to the car scene, when the girls choose a pink facia for the car stereo, which the dad overrides and changes back to black with a satisfied domineering smile on his face. (Clearly the advert or vision is aimed at the male gadgeeters.) To me this interaction is typical of the surface nature: the car stereo is the same stereo with the same functionality, and only its surface colour can be customised  The same way we are stuck with Blackboard as a VLE, which now may have many colour schemes, but we are stuck with the same functionality – the way of teaching cannot really change. To me the future would be if the Dad AND the girls in the car could have both had their own ways – either by colour or by the technology (glass?) allowing them BOTH to have their own preferences as to the car stereo. The other ‘problem’ of this scene in the car is that it is the male, adult world that wins as opposed to the that of the children. The depicted pedagogical vision is similar, we have a benign and efficient lady as the teacher who can provide resources for the children, but children seem to be quite restricted as to how much they can do whilst learning. For instance, there never is an image of a child ‘creating’ or producing something, but only consuming what has been given.
  • And ok, augmented reality is cool, but come on, can someone not come up with anything more imaginative than dinosaurs?
  • Perhaps the coolest (and utopistic) bit is in the hospital – this is when the metaphor of the glass traversing domains (from one kind of scanning to a different kind of patient data analysis) seems to come into its own. Glass as a metaphor for separating AND connecting spaces – and allowing for a liminal knowledge to emerge – this is the scene where it works. So when knowledge is gained by the presence of the medium (glass) as it allows information to be passed on to another domain. In this liminal interchange knowledge is created. This is utopistic.
  • But I don’t see this kind of knowledge emerging in the school (education) or in the car scene (parenting) – it seems just a reinforcement of the present! so not even a dystopia or utopia, it’s just the present jazzed up with some cool surfaces and colour.

Publication news

Some good news about a publication of ours from IGI Global (concerning the whole book, not just our chapter):

“Greetings, I hope you are well. I am pleased to inform you that your research published in the Encyclopedia of Cyber Behavior has contributed to the nomination of this publication for the Outstanding Reference Sources Award by the American Library Association.

This award recognizes and recommends the most outstanding reference publications of the year for small and medium-sized libraries. The Outstanding Reference Sources Committee reviews each title nominated and the results will be published in the May 2013 issue of American Libraries. We will certainly keep you informed of the outcome of this nomination.

The Encyclopedia of Cyber Behavior also recently received a favorable review that was published in Choice Magazine, a publication of the Association for College & Research Libraries, and a division of the American Library Association. In this issue, reviewer R. I. Saltz, Florida Coastal School of Law, remarked:

This encyclopedia features one of the most extensive collections of articles available representing knowledge and research on human behavior in the cyber realm.” […] “Articles, which can stand on their own, provide significant insights into specific areas of knowledge. All three volumes could be read together in order to gain a global understanding of how people are using technology in order to develop themselves and the world around them. Recommended. Upper-level undergraduates and above.”

We take great pride in receiving such commendable reviews and appreciate your hard work and dedication. The IGI Global Newsroom recently featured the chapter from the Encyclopedia of Cyber Behavior entitled “Twitter and Political Elections” in the news piece “Don’t Talk Politics, Tweet About It.” The article discussed social media and its impact on the 2012 Presidential election, and has been highlighted as one of the top news stories of this year. View the Newsroom article here: http://www.igi-global.com/newsroom/archive/don-talk-politics-tweet/1376/.

We encourage you to use the aforementioned research and news in your own research community: forward to your colleagues, post to your own or your organization’s website, as well as your personal social media sites. Your commitment to this title is commendable and deserves the fullest promotion possible. Please do not hesitate to share any additional newsworthy items that we may continue to highlight.

If you haven’t already, we encourage you to recommend this publication to your librarian. The official recommendation form can be found on the IGI Global website at:  http://www.igi-global.com/forms/refertolibrarian.aspx?titleid=59746.

I look forward to hearing from you and appreciate your valuable contribution. Congratulations on the success of this publication.”

So nothing conclusive yet but we shall see!

Tunde


My first SEDA conference, Nov 15, 2012

My highlights –

Blatantly: my workshop went really well. I presented Jaye McIsaac / Ian Willis’ work on combined group process, combining elements of Nominal Group Technique and Focus Group which has worked well with curriculum review and other eval contexts. What a nice thing, but not unexpected, was the participation, knowledge and sharing in my session. I accidentally chose the same question that Julie Hall, SEDA keynote, is tackling today: key challenges of educational developers. I asked my 12 or so participants to identify one key challenge  we then themed it and then voted on it: surprise surprise evidencing impact of our work is top a key challenge? I know the session went well because people kept coming up to me they really enjoyed it and found it useful, and some saw how they can immediately put it into practice. So that’s done! My workshop slides are available together with results of the key challenges as my first Storify story of the conference.

My observation: tweeting is now a mainstream activity amongst educational developers for networking and general conference activity – lots of overlap between SEDA and ALT crowds.

Tunde

Our article on theorising visual methods is out!

Our brand new article on visual methods has been published by the IJRME.  It is entitled “Cultural–historical activity theory and ‘the visual’ in research: exploring the ontological consequences of the use of visual methods”.

It summarises our (Mark, Muriah, Peggy and my) thinking about drawings, diagrams and cartoons, as different visual methods and what their use means for research. This has been a fruitful collaboration that I blogged about on our institutional blog site.

And just in case you are interested in the abstract, here we go:

This article addresses the under-theorization of visual techniques for social science research applications through the cultural–historical activity theory (CHAT). The ‘problem’ of ‘the visual’ in research is given an ontological framing by highlighting the ways in which the use of visual techniques as research tools – designed to elicit participant responses – has a bearing upon the types of data that are produced: the ‘how’ to some degree shapes the ‘what’ of research output. CHAT, by drawing our attention to the ways in which the artefacts we use to mediate researcher–participant relationship (our visual research tools) also affects them, alerts us to the meanings that we (inadvertently, reflexively or even deliberately) create in the research process. Three different kinds of visual techniques are explored according to a CHAT-informed typology: diagrams as a means of eliciting technical information, drawings as a means of eliciting interpretations and judgements and fictional characters as a means of eliciting personal identification. In each case, the ontological consequences of the choice of visual technique for the insight produced are discussed to explore the value of CHAT as one approach to deepening our understanding and appreciation of the value of ‘the visual’ in research.

Tunde

Research Vineyard

I was looking for a good blog title which can describe something to do with research thoughts, a space where I can share my thoughts on readings, confernces, chats and anything else related to research, more specifically educational research. I am a Learning Technologist working at the University of Liverpool with a keen interest in research, on e-learning as well as professional development. I am also very interested in research methods, especially when it involves different modes of communication such as drawing, diagramming – any kind of visuals. More recently, I became interested in a related field, ‘multimodality’ – so hopefully this blog will connect to these themes.

The vineyard of Research

So why vineyard? I like to conceive of research the same way as wine-making, making meaning (wine) from grapes through hard-work and labour of love, knowing the grapes and how to cultivate, nurture them to get the best wine. Different methods yield different results, different vineyards produce different grapes and so on.

Must, the frothy juice before it turns to wine

Must, the frothy juice before it turns to wine

Enjoy!

Tünde

(Tunde Varga-Atkins)